

Performance Analysis and Testing
Updated: Sep 9
This analysis evaluates the sequential performance impact of optimization passes done on a 2048 x 2048 floating-point matrix multiplication workload. The goal of this analysis is to measure the execution speedups, look at how these changes affected CPU cache behavior, and see what further adjustments can be made to improve performance
Hardware Specs
The following analysis was run on the following environment and hardware specs:
Host Processor: Apple M1 Pro (10 cores: 8 performance / 2 efficiency)
Microarchitecture: ARMv8.4-A (Firestorm / Icestorm)
L1 Instruction Cache (L1i): 192KB on Performance Core
L1 Data Cache (L1d): 128KB on Performance Core
Shared Level 2 Cache (L2): 12MB per Performance Core Cluster
System Level cache (SLC/LLC): 24MB Shared SoC Pool
Hardware Cache Line Size: 128 bytes
Virtualization Framework: Ubuntu Linux Docker Container via macOS Hypervisor
Execution Time and Metrics
To evaluate the impact of these optimizations, the compiler was benchmarked using a 2048 x 2048 single-precision floating-point matmul workload.
The execution latency, relative speedup, and sustained GFLOPS across the optimization passes are outlined below:
Optimization | Latency (Seconds) | Relative Speedup | Throughput (GFLOPS) |
|---|---|---|---|
Naive Baseline | 56.11 s | 1.00x | 0.31 GFLOPS |
Transposed | 9.69 s | 5.79x | 1.77 GFLOPS |
Transposed + Tiled | 6.29 s | 8.92x | 2.73 GFLOPS |

Theoretical Peak FLOPS for Apple M1 Pro
Because Apple does not publish official microarchitectural developer manuals detailing peak FP metrics, the theoretical execution limits must be derived. This analysis uses the standard High-Performance Computing (HPC) formula used in the cited source:
Clock Speed: 3.22 GHz
Core Count: single core (1)
FLOPS per Instruction:
M1 Pro chip uses ARM NEON vector engine. NEON registers are exactly 128 bits wide[3]
At this moment, the compiler is only taking in FP32: 32 bits size for a single float for this calculation
A single 128-bit vector register can hold four FP32 at the same time (128-bits/32-bits = 4 elements)
When executing a standard vector instruction, each SIMD instruction operates on four FP32 elements in parallel
Putting it together: 4 elements in parallel (SIMD) x 2 operations per element (FMA)[4] = 8 FLOPs per instruction
To estimate peak performance, I model peak throughput as up to 2 SIMD FMA instructions per cycle:
2 FMAs/cycle: 2ops/FMA x 4 elements/128-bit register x 2 FMA instructions/cycle = 16 FLOPs/cycle/core
Single Core Peak
Since the compiler implementation outputs single-threaded code, I'm going to calculate the theoretical peak for a single Performance core
Single Core Peak = 3.2 GHz x 1 Core x 16 FLOPs/cycle = 51.2 GFLOPS
Naive Baseline: (0.31 FLOPS/51.2 GFLOPS) x 100 = 0.60% efficiency
Tiled + Transposed: (2.73 GFLOPS/51.2 GFLOPS) x 100 = 5.33% efficiency
While the final optimized pipeline achieved a 8.92x speedup over the baseline, its sustained performance of 2.73 GFLOPS represents 5.33% of a single M1 Pro performance core's theoretical FP32 ceiling (51.2 GFLOPS).
Despite the speedup, performance remains significantly below the estimated single-core FP32 peak. This suggests that additional optimization opportunities remain. To identify potential bottlenecks in the generated code, I performed a cache and memory analysis using Valgrind Cachegrind.
Memory and Cache Analysis with Valgrind
Note: Cachegrind acts as a deterministic simulation model. It doesn't capture Apple Silicon's proprietary prefetchers or 128-byte cache lines when run within a Docker container, it provides a highly reproducible baseline for validating software-level memory access
To better understand the impact of the optimization passes done for this compiler, I profiled the workload using Valgrind's Cachegrind, a cache profiler that performs simulation of the l1, D1 and L2 caches in a CPU to pinpoint the sources of cache misses.[5]
Running Cachegrind on a 2048 x 2048 matmul shows the following summary run (on naive implementation), you can see the configurations at the top:

I run them multiple times with different optimization levels and compiled them into a table (you can find the final runs on the tests/Correctness dir in the codebase):
Metric | Naive | Transposed | Tiled + Transposed |
Ir (Instructions) | 77,833,247,864 | 77,816,217,685 | 84,074,279,975 |
I1mr (L1i Miss) | 761,571 | 496,951 | 608,631 |
ILmr (LLi Miss) | 79,495 | 79,411 | 84,793 |
Dr (Data Reads) | 17,326,679,559 | 17,320,366,278 | 18,553,669,186 |
D1mr (L1d Miss) | 8,595,322,721 | 273,547,987 | 426,478,453 |
DLmr (LLd Miss) | 8,594,848,738 | 273,345,444 | 9,105,162 |
Dw (Data Writes) | 8,677,066,968 | 8,675,653,160 | 9,094,546,035 |
D1mw (L1d Write Miss) | 639,116 | 876,908 | 904,263 |
DLmw (LLd Write Miss) | 569,039 | 830,780 | 832,240 |
LLC Miss Rate (Read) | 49.6% | 1.57% | 0.0004% |
L1 Miss Rate (Read) | 49.6% | 1.57% | 2.3% |
Naive Implementation
In the naive baseline, the processor suffered 8.59 billion L1 Data Cache Misses (D1mr). With 17.32 billion total data reads, this represents a 49.6% L1 data read miss rate. The CPU was constantly waiting for data because of stride-by-stride memory accesses across non-contiguous memory layouts
Transpose RHS Matrix
Running the transposition on the RHS matrix converted the non-contiguous column accesses into sequential, contiguous row accesses. As a result, L1 Data Cache misses (D1mr) lowered from 8.59 billion to 273.5 million, which is a 96.8% reduction in L1 read misses. The Last-Level Cache misses (DLmr) has also improved at a similar rate.
Tiled + Transposed
Adding the tiling pass further reduced Last-Level Cache misses (DLmr), dropping from 273.5 million to 9.1 million, indicating improved data locality at the LLC level. However, L1 Data misses (D1mr) increased by approximately 150 million compared to the non-tiled version
This shift suggests a change in the memory access pattern introduced by tiling: while LLC reuse improved significantly, the inner-kernel structure may have increased pressure on L1 through additional per-tile buffering and repeated accesses within smaller working sets.
The goal of the following analysis is to determine whether this behavior is an expected trade-off from tiling (increased L1 activity with reduced LLC traffic), or whether it indicates inefficiencies introduced during bufferization or kernel generation
The summary run for tiled + transposed run on 2048 x 2048 matmul on Cachegrind:

Tiling Correctness
Looking at the tensor IR, tiling is structurally correct and applies at the expected loop levels (3D loops at 64x64x64 tiles)

MemRef IR
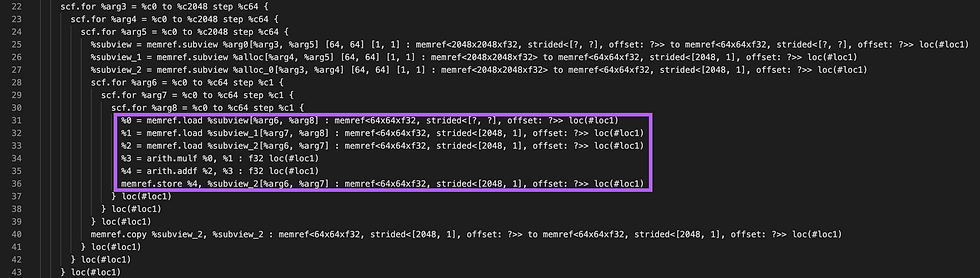
The generated MemRef IR materializes the output tile (alloc_3) as a memory-backed accumulator for each 64x64 block. Instead of being lowered as a pure SSA-level reduction (i.e., an accumulator value carried in registers across the K-loop), the accumulation is implemented as a repeated load-modify store sequence on a memref. Each iteration of the K-loop loads the current partial value, performs a fused mul-add, and writes the result back to memory.
This indicates that the reduction was not scalarized into an SSA register accumulator during bufferization/loop lowering. As a result, bufferization falls back to a conversative memory-based model, introducing unnecessary memory traffic within the inner loop.

Additionally, the Cachegrind run above shows that memref.copy accounts for roughly 3% of all executed instructions, while the generated memcpy calls contribute an additional 2.5%
Additional Memory Overhead
From MemRef IR, it also shows that it's copying a data located at a memory space referenced by '%subview_2' right back into exact same memory space referenced by '%subview_2' which appears to be a redundant copy operation likely introduced during bufferization or missed CSE/canonicalization.

The Cachegrind summary run above also shows over 5B instructions for memref.copy
Conclusion
The tiled transformation successfully improves the large reduction in LLC misses but the lowered IR shows that the inner kernel still performs repeated load-modify-store operations on the output tile within the reduction loop. This introduces additional L1-level memory traffic, such as partial accumulation is repeatedly materialized through memory-backed tile buffers within reduction loop
To fix the load-compute-store cycle on C, I would recommend hoisting[6] C load outside of K loop, keeping a temporary accumulator in SSA or scalar form and store back only once per tile. Since Cache profiling shows a large number of memref.copy operations, I will also improve buffer reuse and enable in-place bufferization where possible. Finally, the transpose optimization is currently embedded inside the lowering pass on linalg.generic, as a result, transpose is not expressed in structured IR form (indexing_map/linalg.matmul), preventing downstream structured optimizations from recognizing it as a composable affine transformation. To fix this, the pipeline should be refactored to lower to linalg.matmul and create a separate pass for transpose optimization or use linalg.matmul indexing maps to transpose the rhs matrix.
Improvement After this Run
I disabled 'allowReturnAllocsFromLoops' after this run, and that eliminated the extra memref.copy in the IR, and reduced the executed instructions in the tiling + transpose run from 84 billion to 78 billion, which is a 6% reduction in executed instructions, which reduced the run time from 6.3s to to 5.8s. The Cachegrind summary is shown below.
When this option is enabled, allocations created within loop bodies are allowed to escape the loop through loop-carried values. To preserve correctness, the bufferization pass may conservatively insert additional memref.copy operations when propagating buffers across loop iterations. Changing it to false prevent loop-local allocations from escaping the loop

Testing
In this project, I used LLVM's Lit testing framework (llvm-lit) to automatically discover and execute all tests in the tests/ directory. All .mlir and .py files are executed as shell-based tests using FileCheck assertions
Tests are run from the build directory using:
../../../llvm-project/build/bin/llvm-lit -v ../tests/The test configuration is defined in lit.cfg.py, which:
Registers .mlir and .py files as test inputs
Uses lit.formats.ShTest to execute tests as shell commands
Defines %driver as the compiler driver binary
Configures the environment PATH to include LLVM binaries (e.g., FileCheck)
Correctness
I used 3 different methods to test the project for correctness:
MLIR's FileCheck-based testing framework
Validation against NumPy
Validation against ONNX Runtime
MLIR's FileCheck
In this method, I used the FileCheck testing framework combined with the JIT execution driver to validate both correctness and runtime behavior of compiled programs. Each test is written as an .mlir file that is executed through the compiler pipeline and verified against expected output using CHECK directives
The test cases validated two key properties:
Shape Correctness: makes sure that tensor ranks and shapes produced at runtime match the expected output types
Numerical Correctness: makes sure that computed values match reference semantics of the operation after lowering and execution
For example, in add_execution.mlir, I verify elementwise addition on two constant tensors:
Input: [1.0, 2.0] and [3.0, 4.0]
Expected output: [4.0, 6.0]
Validation checks confirm both output shape [2] and elementwise values
// RUN: %driver -emit=jit %s | FileCheck %s

module {
	func.func @main() -> tensor<2xf32> attributes {llvm.emit_c_interface} (
		%cst = arith.constant dense<[1.0, 2.0]> : tensor<2xf32>
		%cst_0 = arith.constant dense<[3.0, 4.0]> : tensor<2xf32>

		%0 = "dlc.add"(%cst, %cst_0) : (tensor<2xf32>, tensor<2xf32>) -> tensor<2xf32>
		return %0 : tensor<2xf32>
	}
}

// CHECK: Result Shape: [ 2 ]
// CHECK: Data: [4.0{{0*}}, 6.0{{0*}}]
Validation against NumPy
I compared the compiler execution results against NumPy results
Each test follows a dynamic validation pipeline:
Generate random input tensors with NumPy
Compute expected output with NumPy
Generate MLIR test program dynamically
Execute through compiler JIT driver
Parse runtime output and validate correctness
For example, to verify ReLU activation function:
Input is sampled from a uniform distribution in [-1, 1]
Expected output is computed using: np.maximum(0, input)
/// tensor-compiler/src/tests/Execution/verify_relu.py
# RUN: python3 %s

# generate random input and its expected output
# start with 4 random numbers from [0, 1), then *2 to get [0, 2),
# then -1 to get [-1, 1)
input_data = (np.random.rand(4) * 2 - 1).astype(np.float32)
expected = np.maximum(0, input_data)

# Generate the mlir test program
mlir_template = f"""
module {{
	func.func @main() -> tensor<4xf32> attributes {{llvm.emit_c_interface}} {{
		%0 = arith.constant dense<{input_data.tolist()}> : tensor<4xf32>
		%1 = "dlc.relu"(%0) : (tensor<4xf32>) -> tensor<4xf32>
		return %1 : tensor<4xf32>
	}}
}}
"""

# create the mlir file
with open(temp_mlir_path, "w") as f:
	f.write(mlir_template)

# Execute JIT
try:
	result = subprocess.check_output([driver_path, "-emi=jit", temp_mlir_path]).decode()

	match = re.search(r"Data:\s*\[(.*?)\]", result)
	if match:
		actual_data = match.group(1).replace(',', ' ').strip()
		actual = np.array([float(x) for x in actual_data.split()], dtype=np.float32)
		if np.allclose(actual, expected, atol=1e-5):
			# success message here
		else:
			# failed message here
# cleanup
Validation against ONNX Runtime
To validate correctness and optimization behavior at the model level, the compiler is tested against ONNX Runtime (ORT) as reference execution engine. Unlike NumPy-based testing above, which validates individual tensor operations, this approach verifies correctness on the actual matmul workloads.
It follows the following execution pipeline:
Generate random inputs
Compute ground truth using ONNX Runtime
Run compiler across multiple optimization configurations
Multi-stage IR dump
JIT execution and validate outputs
The system classifies results into:
Bit-accurate match (max diff = 0)
Numerically correct (max diff < 1e-5)
Acceptable FP deviation (max diff < 1e-3)
Failure case (above threshold)
This allows separation of exact correctness, FP accumulation effects, and actual compiler bugs
It also tracks execution time using Chrono for performance analysis, which has been covered above.
/// test script can be found in: tensor-compiler/src/tests/Correctness/verify_matmul.pyConversion
This section verifies the correctness of compiler lowering passes from the custom dlc dialect down to standard MLIR and LLVM-compatible representations. Validation is performed using FileCheck-based pattern matching to ensure each transformation produces the expected IR structure.
Across all tests, the following properties are validated:
Dialect correctness
Structural correctness (loops, memory operations, control flow)
Type and shape correctness (tensor types and shapes, scalar/memory types)
The example below validates lowering from the tensor dialect to mlir-memref representation. It verifies:
constant values are materialized as memref globals
tensor level linalg operations are structured into explicit loops
scalar arithmetic is correctly lowered (arith.addf)
results are written through memref.store operations
/// tensor-compiler/src/tests/Conversion/tensor-to-memref.mlir

// RUN: %driver -emit=mlir-memref %s | FileCheck %s

module {
	func.func @main() -> tensor<2xf32> attributes {llvm.emit_c_interface} (
		%cst = arith.constant dense<[1.000000e+00, 2.000000e+00]> : tensor<2xf32>
		%cst_0 = arith.constant dense<[3.000000e+00, 4.000000e+00]> : tensor<2xf32>
		%0 = tensor.empty() : tensor<2xf32>
		%1 = linalg.add ins(%cst, %cst_0 : tensor<2xf32>, tensor<2xf32>) outs(%0 : tensor<2xf32>) -> tensor<2xf32>
		return %1 : tensor<2xf32>
	}
}

// CHECK-LABEL: func.func @main
// CHECK-DAG: %[[GLOBAL0:.*]] = memref.get_global @__constant_2xf32
// CHECK-DAG: %[[GLOBAL1:.*]] = memref.get_global @__constant_2xf32
// CHECK:       %[[ALLOC:.*]] = memref.alloc()
// CHECK:       scf.for %[[IDX:.*]] = %{{.*}} to %{{.*}} step %{{.*}} {
// CHECK:         %[[VAL0:.*]] = memref.load %[[GLOBAL0]][%[[IDX]]]
// CHECK:         %[[VAL1:.*]] = memref.load %[[GLOBAL1]][%[[IDX]]]
// CHECK:         %[[SUM:.*]] = arith.addf %[[VAL0]], %[[VAL1]]
// CHECK:         memref.store %[[SUM]], %[[ALLOC]][%[[IDX]]]
// CHECK:       }
// CHECK:       return %[[ALLOC]]
Error Handling
This section outlines how the compiler handles errors and enforces structural invariants during compilation. It uses a combination of static verification and pass validation to catch wrong operations early. Across the tests, this is the behavior that is validated:
Used the 'not' utility to ensure the compiler driver correctly exits a non-zero status code when encountering broken IR
Uses 2>&1 to pipe stderr directly into FileCheck
Match the diagnostic message to guarantee the error conditions are handled by compiler verifiers
For example, in the shape mismatch test, a 2-element tensor shouldn't be added with a 1-element tensor. The verifier detects this violation
/// tensor-compiler/src/tests/error-handling/test_error.mlir

// RUN: not ../../build/driver -emit=mlir %s 2>&1 | FileCheck %s
module {
	func.func @main() {
		%0 = "dlc.constant"() <{value = dense<[1.0, 2.0]> : tensor<2xf32>}> : () -> tensor<2xf32> loc("const1")
		%1 = "dlc.constant"() <{value = dense<[3.0]> : tensor<1xf32>}> : () -> tensor<1xf32> loc("const2")

		// ERROR: Adding a tensor<2> to a tensor<1>
		%2 = "dlc.add"(%0, %1) : (tensor<2xf32>, tensor<1xf32>) -> tensor<2xf32> loc("broken_add")
		return
	}
}

// CHECK: error: 'dlc.add' op requires LHS and RHS to have the same shape
Conclusion
Building this compiler provided a practical foundation in mapping high-level tensor operations down to loops and memory buffers. Profiling the workload highlighted the relationship between memory layout and hardware latency. Transposing the RHS matrix eliminated major L1 cache misses, dropping latency from 56.11s to 9.69s. While tiling initially added runtime overhead due to loop bufferization settings, disabling it removed redundant memref.copy calls, which brings execution down further to 5.8s
For testing, I verified correctness in the results, IR lowering, and error handling using Lit and FileCheck, validating against both NumPy and ONNX Runtime. These checks ensured numerical accuracy, shape matching, and structural invariants across the compilation pipeline
To further improve performance, I would recommend implementing vectorization to process 4 floats per instruction and increase the GFLOPS throughput. I would also inspect the IR and Cachegrind results further to ensure that there are no more redundant operations and optimize for buffer reuse.
The testing could also be extended for more operations, mismatches on element type, shape, or rank/dimension, and for specific memref errors such as layout/stride mismatches and memory space mismatches.


Comments